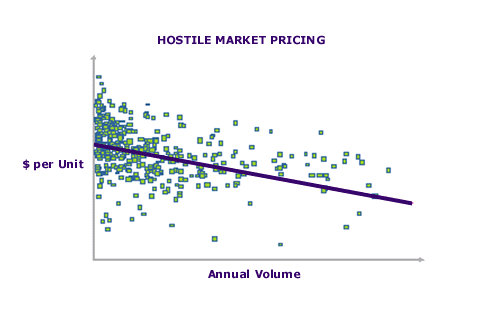
Analysis 67: Unit Price by Customer Size
EXHIBITS:

| HOW TO INTERPRET THE ANALYSIS: This exhibit, drawn from a real industry, shows the annual total purchase volume (i.e., from all suppliers in the customer's relationship) by customer plotted against the price per unit paid by the customer for the Standard Leader product. The price per unit paid is a net price, adjusted for all discounts and allowances. The annual volume for each customer includes all sales made to that customer during the year by all suppliers in the various roles the customer has in its relationship. The line drawn through the plot points is a least squares fit regression line. This line is a good proxy for the average price paid by customers at any given volume of total purchases. The slope of this regression line is downward, meaning that larger customers tend to pay lower prices than smaller customers. But note that there are a number of Small and Medium customers who pay very low prices and also a number of Large and Very Large customers who pay relatively high prices.
PURPOSE: This analysis helps the Company begin to address reasons why customers of similar sizes pay radically different prices for the Standard Leader product. Small and Medium customers who pay low prices become the focus of analyses to determine whether the customers are attractive to the Company at their current price levels and the reasons they are able to achieve such low prices. On the other hand, Very Large and Large customers who pay high prices become the focus of an analysis of what we offer those customers in the market that gives them an incentive to pay these high prices. Alternatively, the Very Large and Large customers who pay high prices may simply be poor negotiators. This may suggest that the excess margin we earn on the business of these customers may be at risk if their management policies change.
APPROACH: The Company uses internal information to create this analysis. From its sales force, it gathers an estimate of total purchases that a sample of current Company customers makes from all the suppliers in the market. The Company uses its own pricing data to get the net price paid for the Standard Leader product for each customer. The combination of these two facts for each customer provides the plot points for the analysis. Return to Price Sensitivity Among Customers or Increasing Margins by Improving Customer Mix |
|
Recommended Reading |
| For a greater overall perspective on this subject, we recommend the following related items:
Analyses: Symptoms and Implications: Symptoms developing in the market that would suggest the need for this analysis.
Perspectives: Conclusions we have reached as a result of our long-term study and observations.
|
