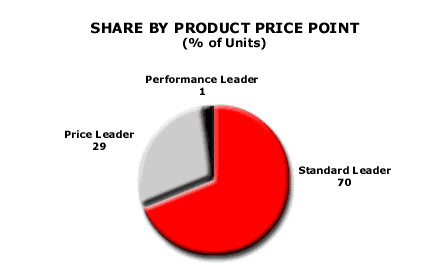
Analysis 39: Market Share by Product Price Point
EXHIBITS:

HOW TO INTERPRET THE ANALYSIS: This exhibit shows the total market share, in units, for three Price Points in the industry. The set of Standard Leader Price Points controls 70% of the unit volume in the industry. The low-end, Price Leader, Price Point products control 29% of the unit volume. In this industry, the Performance Leader Price Points have only 1% of the industry's total unit sales.
PURPOSE: This analysis quantifies the size of each product price point category. The company would use this analysis either to anticipate its Core customer movement into a price point or to question whether the company needs to cover a price point in order to hold and grow its current Core customer volume. APPROACH: If possible, this analysis should be done using unit, rather than dollar, volume in the marketplace. The reason for preferring units is that costs tend to be more a function of units sold than of dollar volume. However, if units are not available, the company can use dollar volume. A deeper analysis on this theme is to conduct the price point share analysis only for the target Core customer group. The company's target Core customers may buy somewhat differently than the market as a whole. Their needs are paramount in importance.
Examples of: |
|
Recommended Reading |
For a greater overall perspective on this subject, we recommend the following related items:
|
