Analysis 10: Size and Role Segmentation Matrix
EXHIBITS:
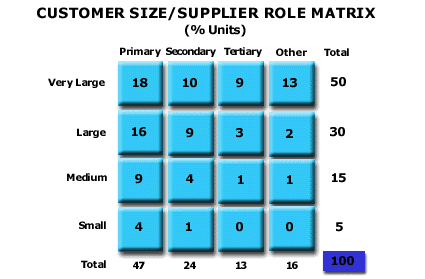
HOW TO INTERPRET THE ANALYSIS: This exhibit portrays the total unit sales in the market by the size of the customer and the Role within the customer relationship. The upper left hand position on this matrix shows that 18% of the total industry sales were made to the Very Large customers in those customers’ Primary role position. If the industry sold 2000 total units, this 18% in the Very Large/Primary Role position would represent 360 units of sale. In other words, the total sales to all Very Large customers in the marketplace in their Primary Role relationship was 360 units, representing 18% of the total industry sales volume. This Very Large/Primary role is a segment of the market.The totals on the horizontal and vertical axes of the matrix are interpreted the same way. The horizontal totals at the bottom of the matrix show that 47% of total industry sales were made to customers in the market in their Primary Role position. If the total industry sales were 2000 units, then 940 total units were sold to customers in the Primary Role position of their relationship. Twenty four percent of total industry sales, or 480 units, were sold to customers in the marketplace in their Secondary Role positions. The totals in the vertical column of the matrix indicate the total percentage of industry sales by size segment of the customers. Fifty percent of total industry sales were made to Very Large customers. If industry sales were 2000 units, 1000 units in total were sold to Very Large customers. Thirty percent of industry sales were made to Large customers. If total industry sales were 2000 units, then 600 units were sold to Large customers.
PURPOSE: This analysis continues the segmentation by sales volume. It breaks down the entire market both by size of customer and by role in the average customer relationship. It enables the Company to identify the high volume segments in the market. Each combination of size and role on the matrix is a segment. Size/Role Matrix: Industry Examples »
APPROACH: In many markets, customers buy the same product from more than one supplier. The supplier who has the greatest amount of that product’s volume sales to the customer has the Primary position. The supplier with the next most volume in the customer’s relationship has the Secondary position, and so forth. The Company should sample customers of each size category and establish how much volume, as a percentage of their total purchases, they offer to their Primary, Secondary and Tertiary suppliers. These percentages of their relationships should be averaged for each size category to produce an estimate for the percentage for each role. The Company multiplies this percentage by the total sales percentage for the size segment (e.g., by 50% for VL customers) to arrive at the figures in the matrix. Each of these segments in the industry has different attractiveness to competitors in the marketplace. The leading competitors would be most interested in the Primary and Secondary positions with the better customers. Very often, smaller competitors have to seek less prestigious positions in the market because they do not offer the value proposition that is sufficient to fill the best positions in the marketplace. These competitors may fall into different competitor tiers than do the larger competitors. |
| Recommended Reading |
For a greater overall perspective on this subject, we recommend the following related items:Analyses:
Symptoms and Implications: Symptoms developing in the market that would suggest the need for this analysis.
Perspectives: Conclusions we have reached as a result of our long-term study and observations.
|