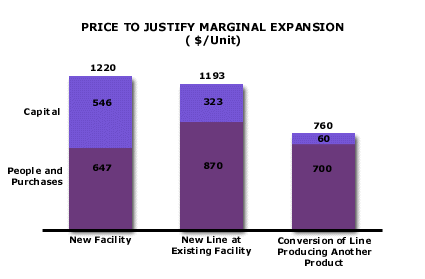
Analysis 61: Unit Equivalent Sales Price Needed to Justify Marginal Capacity Addition
EXHIBITS:

| HOW TO INTERPRET THE ANALYSIS: This exhibit demonstrates the price, through a business cycle, that would be necessary to justify new capacity addition in the industry. There are three types of capacity addition shown. The first is the most expensive, a new Greenfield facility. The second is a less expensive form of capacity addition, where the company would add an additional production line at an already existing facility. Finally, there is the lowest cost, easiest to justify, capacity addition, a conversion of a manufacturing line producing another product. The cost of this line does not reflect the loss in contribution margin from the product that will no longer be produced on the line.
There are two sources of cost that must be covered in order to justify each type of capacity addition. The first source is the operating cost that is the sum of the costs of people and purchases. In a new facility, the company will need $647 per year to pay for the people and purchases. The second source of cost is the cost of capital. The company will need a further $546 per year to amortize its capital investment in the new facility at its cost of capital. When we add the costs of people, purchases and capital together, we get a price of $1220 per unit. If the company would conclude that, through the business cycle, its average price will be $1220 per unit, it can safely invest in a new facility with the assurance that it will cover all its operating costs (i.e., its people and purchases) and earn enough to pay its depreciation and all capital charges at its cost of capital. At the other end of the scale, perhaps the company is living through a low-price market. In that case, the company need satisfy itself only that through the business cycle, it will see a price per unit sold of $760 in order to justify conversion of a line producing another product to the current product. With a $760 average price through the business cycle, the company will cover its full people and purchases costs of $700 and still have $60 left over to pay for depreciation and all capital charges on its marginal investment. PURPOSE: This analysis helps the company predict the direction and likely limits of future prices. It also helps the company plan its own capacity additions. Most new capacity will come on-stream only when the company and its competition have incentive to build it. This analysis projects the price at which the company should expect to see new capacity coming into the market. It also projects the type of capacity growth the company should monitor and evaluate further. APPROACH: The company would determine for itself, as well as for its major competition: 1) the price level that will bring this capacity on stream and pay all of the new capacity's cash operating and capital carrying costs and 2) the amount of capacity, stated as a percentage of annual demand, that is available to be added with each source. The operations and finance functions estimate the cost of additional capacity, as well as the amount of capacity that could become available, in a defined period of time, using each of the potential capacity-adding methods, starting with the least costly and moving to the most costly method. The cost of each form of new capacity is expressed in the equivalent of a price for a unit of product. In the example shown, each new capacity option has its cost stated in terms of the average market price per unit of product the industry would have to realize, through a business cycle, in order to pay for the new capacity's capital and operating costs. The company would compare the rate of this potential capacity addition to unit demand growth in the marketplace to estimate the direction of future prices. If predicted demand grows faster than the rate that inexpensive (i.e. with prices below today's prices) new sources of capacity can come on stream, prices should rise to bring on more expensive forms of new capacity. If, on the other hand, sufficient capacity can come on stream, at or below current prices, to meet projected levels of future demand, industry prices are likely to stay flat or decline, in real terms. The company would use this analysis to project future prices and to plan its own capacity additions. Return to Diagnose Pricing: Future Capacity |
|
Recommended Reading |
| For a greater overall perspective on this subject, we recommend the following related items:
Analyses:
Symptoms and Implications: Symptoms developing in the market that would suggest the need for this analysis.
Perspectives: Conclusions we have reached as a result of our long-term study and observations.
|
