Analysis 68: Relative Price by Customer
EXHIBITS:

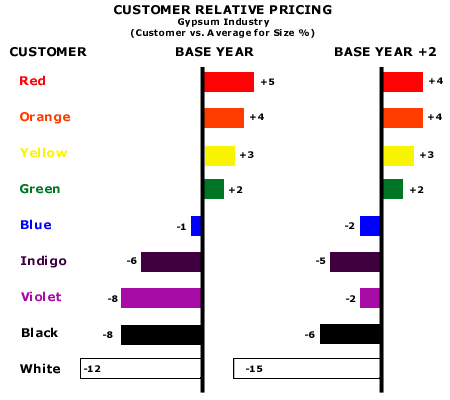
| HOW TO INTERPRET THE ANALYSIS: This exhibit, drawn from the Gypsum industry, shows customer prices paid relative to the least squares fit regression line for the industry in two separate years, the base year and two years after the base year (See Analysis 67 for a further explanation). Each of the customers is plotted by showing its lower (negative numbers) or higher (positive numbers) prices relative to this least squares regression line. For example, the Red customer paid prices five percentage points above the regression line in the Base Year. So, if prices on the regression line were 100, the Red customer paid a price of 105. In the Base Year +2, the Red customer paid a price four percentage points above the least squares fit regression line for that year. If pricing in the Base Year +2 had moved to 120, the Red customer would have paid a price of 124.8. Normally, we assume that any customer who pays prices in the Base Year +2 within 1% of those in the Base Year is paying the same relative price. Note that, in this example, the last three customers, Violet, Black and White, are each paying relative prices more than 2% different in the Base Year +2 than they were paying in the Base Year. By our rule, these customers were paying different relative prices in the Base Year +2.
PURPOSE: This analysis helps the Company begin to address reasons why customers of similar sizes pay radically different prices for the Standard Leader product. Small and Medium customers who pay low prices become the focus of analyses to determine whether the customers are attractive to the Company at their current price levels and the reasons they are able to achieve such low prices. On the other hand, Very Large and Large customers who pay high prices become the focus of an analysis of what we offer those customers in the market that gives them an incentive to pay these high prices. Alternatively, the Very Large and Large customers who pay high prices may simply be poor negotiators. This may suggest that the excess margin we earn on the business of these customers may be at risk if their management policies change.
APPROACH: The Company uses the plot points and regression line in Analysis 67 for both the Base Year and the Base Year +2. The Company calculates the distance in percentage terms that each customer's net price is compared to the least squares fit regression line. Return to Price Sensitivity Among Customers |
|
Recommended Reading |
| For a greater overall perspective on this subject, we recommend the following related items:
Analyses: Symptoms and Implications: Symptoms developing in the market that would suggest the need for this analysis.
Perspectives: Conclusions we have reached as a result of our long-term study and observations.
|
