Analysis 34: Reasons for Company Negative Volatility
EXHIBITS:

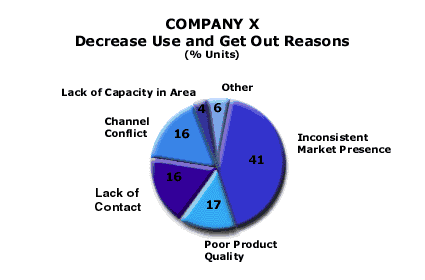
HOW TO INTERPRET THE ANALYSIS: The exhibit lists the reasons for the company's Negative Volatility events where the company lost some (Decrease Use) or all (Get Out) of its sales to existing customers. Forty one percent of the total losses the company sustained in its customer relationships was due to inconsistent market presence. This means that the company changed its policies toward its customers in ways that appeared unfair to those customers. Seventeen percent of the company's Negative Volatility was the result of poor product quality. Sixteen percent of the company's Negative Volatility was due to lack of contact, where the company did not call on or sell to the customer with the frequency the customer preferred. Another sixteen percent of the company's Negative Volatility was due to channel conflict, where the company was perceived by some customers as either serving or favoring direct competitors.
PURPOSE: Whether the company is a share gainer or loser, it should understand why it experiences negative volatility. This analysis does that. Its purpose is to highlight changes that the company must make in its product and service package to improve the retention of its current customers in the marketplace. APPROACH: The company interviews the customers who reduced the proportions they bought from the company in order to complete this analysis. Ideally, the company should convert these reasons for Negative Volatility into the specific performance and price improvements needed to correct the company's shortcomings, and then rank order them according to the percentage of volume lost. These rank ordered potential improvements become candidates for the company's Value Proposition changes.
In the event that the company is unable to follow the approach of interviewing the customers who decreased their purchases of the company's products, the company may use the impressions of its sales force to develop a list of the reasons that companies lose customer relationships. Again, this list should be rank ordered according to the percentage of sales lost for each reason. Reasons for Negative Volatility: Industry Examples» For further description of how to use market data to develop performance innovations, see Analysis 35. Return to Diagnose Products and Services: Reasons for Negative Volatility |
|
Recommended Reading |
| For a greater overall perspective on this subject, we recommend the following related items:
Analyses:
Symptoms and Implications: Symptoms developing in the market that would suggest the need for this analysis.
Perspectives: Conclusions we have reached as a result of our long-term study and observations.
|
