Analysis 37: Share Sources and Beneficiaries
EXHIBITS:

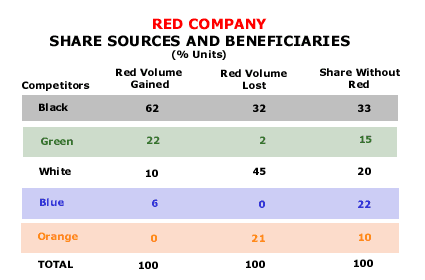
| HOW TO INTERPRET THE ANALYSIS: This exhibit shows the sources of share gain and the beneficiaries for the share loss of the Red company. The Red company has five competitors: Black, Green, White, Blue and Orange. The market share of each competitor, without Red in the marketplace, is listed in the last column. For example, the Black company has a 33% market share without Red. If the competitor has no particular advantage, or disadvantage, compared to the Red company, we would expect that its volume gain from Red as well as the volume loss to Red would be something approximating its market share without Red in the market. In this exhibit Red is considerably stronger than Black. Red gained 62% of its total new volume from Black and lost only 32% of its volume lost to Black. On the other hand, the White competitor looks stronger than Red. White has only a 20% market share without Red being in the marketplace. The White competitor accounted for only 10% of the volume gained by Red and was responsible for 45% of the volume that the Red company's lost. White lost less than its market share to Red and gained considerably more than its market share from Red. So White looks like a much stronger competitor than Red. The company can use a comparison of its own offerings against those of both Black and White to gain a better understanding of its relative strengths and weaknesses in the eyes of volatile customers in the market.
PURPOSE: This analysis evaluates the volume gained from, or lost to, each other competitor in the marketplace in order to identify those competitors posing significant risks or offering the best opportunities to the company. APPROACH: The company evaluates all volatile volume over a period of time. It classes that volatile volume into both positive and negative volume. It measures both positive and negative volatile volume by the other competitor associated with the change. For example, each time that a company gains volatile volume from another competitor, the company would list that competitor as well as the total volume he gained. The company then calculates the total percentage of the volatile volume gained from each competitor as well as the total percentage lost to each competitor to produce this table. The company calculates the market share of each competitor when the company is not included in the market. This is the base number used to compare the strengths and weakness of the company compared of its competition. An example of how to use this analysis follows: The analysis above shows share sources and beneficiaries over a period of time for the Red company. It competes with five other companies: Black, Green, White, Blue, and Orange. The Red company both gained and lost volume in the marketplace. Of the volume the Red company gained, the Black competitor provided 62%. The Orange competitor provided none of the volume that the Red company gained. The White company was responsible for gaining 45% of the volume that the Red company lost. On the other hand, the Blue company was able to gain any share from the Red company. The further column in the table shows the market shares of each competitor in the marketplace when the Red company is removed from the market. The Black is the largest competitor with 33% of the market. The Orange is the smallest competitor with 10% of the market. The Red company can compare its percentage volume gained or lost to any competitor against that competitor's share shown in the fourth column of the table. For example, the Red company does very well against the Black company. An analyst can reach this conclusion by evaluating the percentage of the Red company volume gained from Black at 62% and comparing that to the overall share of the market Black has without Red's participation at 33%. If the Red company had gained from each competitor in roughly the same proportion that each competitor has of the market without Red's inclusion, then each competitor would have surrendered its market share amount to Red. The Red company then should have gained about 33% of its volume gain from Black. Instead, it gained nearly twice that amount. On the other hand, the White company is a very difficult competitor for the Red company. Red gained less than half of its expected percentage of White's market share in direct competition with White. But it lost over two times the amount of volume that White should have been able to gain from Red. The Orange competitor is also a very difficult competitor for the Red company. Return to Diagnose Products and Services: Reasons for Negative Volatility |
|
Recommended Reading |
| For a greater overall perspective on this subject, we recommend the following related items:
Analyses:
Symptoms and Implications: Symptoms developing in the market that would suggest the need for this analysis. Perspectives: Conclusions we have reached as a result of our long-term study and observations.
|
