Analysis 53: Return on Investment
EXHIBITS:

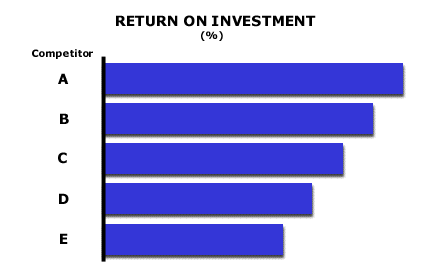
| HOW TO INTERPRET THE ANALYSIS: The exhibit is shown without numbers. However, it is clear that Competitor A has a significantly better Return on Investment than does Competitor E. Competitor A has a lower overall cost structure than does Competitor E .
PURPOSE: This analysis enables the company to evaluate its Return on Investment compared to each of its competitors. This analysis identifies the low-cost competitor in the market place and helps set reasonable performance targets for the next three years. APPROACH: Most of this analysis comes from examination of publicly available information. There are three measures of Return on Investment that may prove useful. The first is Return on Equity (ROE). Return on Equity is the result of dividing the profit after tax of a competitor by the sum of its total shareholder' equity. The second is Return on Net Caplital Employed (RONCE). The Return on Net Capital Employed (RONCE) is the result of dividing the EBIT of a competitor by the sum of its total debt plus equity, the Net Capital Employed (NCE). In many industries, information is available on a business line basis, where companies allocate operating profits, assets and sales to a business line described by SIC code. These data provide more accurate pictures of the pure returns of competitors in an industry. Where this level of data is available, the measure used for this analysis is Return on Assets (ROA), which is operating profits divided by total allocated assets. The Company with the lowest overall cost position will have the highest pretax Return on Assets (ROA) or Return on Net Capital Employed (RONCE) or Return on Equity (ROE). The Company would use the competitor with the highest returns to benchmark and evaluate its own operations. Return to Diagnose Costs: Measuring Current Shortfalls in Financial Markets |
|
Recommended Reading |
| For a greater overall perspective on this subject, we recommend the following related items:
Analyses: Videos: Symptoms and Implications: Symptoms developing in the market that would suggest the need for this analysis. Perspectives: Conclusions we have reached as a result of our long-term study and observations.
|
