Analysis 29: Index Comparison of Company and Industry Volatility on the Customer Size/Role Matrix
EXHIBITS:
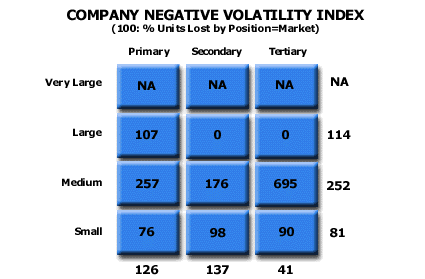
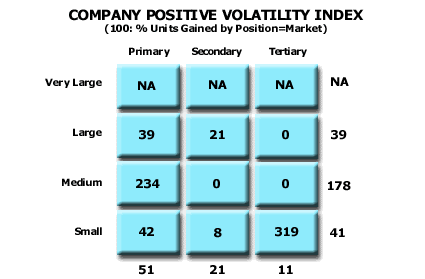
| HOW TO INTERPRET THE ANALYSIS: The two exhibits shown here compare the company to the industry on both Negative and Positive Volatility. The measures are shown on an index basis, where the results for the industry are indexed at 100. Beginning with the Negative Volatility, the exhibit shows that the company performs worse than the industry in both the Primary and Secondary Roles and also in the Large and Medium sized customer categories. The company’s Negative Volatility was 26% higher than that of the industry in the Primary Role position. It was 37% higher than the industry in the Secondary Role position. The company’s Negative Volatility with Large customers was 14% higher than the industry while its Negative Volatility with Medium customers was 152% higher than the industry. Moving to the Positive Volatility, the company did not outperform the industry in any Role. It did outperform the industry in the Medium sized customer category. It under-performed the industry in all other size categories as well as in all the Roles. The combination of the two charts suggests a very weak company in its industry. Its Negative Volatility was higher than the industry while its Positive Volatility was lower.
PURPOSE: This analysis shows where the company is relatively strong or weak compared to the rest of the industry in exploiting volatility opportunities in the marketplace. This analysis gives better definition to the company’s strengths and weaknesses by showing them in the setting of the customer size and role segmentation matrix. This analysis should enable the company to develop a better value proposition improvement program by helping the company focus only on those customer segments it wishes to target. APPROACH: The company estimates industry volatility by size and role from its sample of the marketplace customers. It distributes both the positive and the negative volatility, respectively, across the matrix of customer size and role positions. It then creates share points of total unit volatility by size and role segment in the industry by making the total market volatility equal 100 points and then dividing the volatile volume in each position by the total market volatility volume to produce the segment’s share of total volatility. The company would conduct a similar analysis for its own volatility. The index is equal to the company volatility percentage divided by the industry volatility percentage. That result is multiplied by 100 to give the final index figure. An index is a measure of the performance of one entity relative to another entity. The index is the ratio of the performance of the first entity divided by the performance of the second and then multiplied by 100. An index above 100 indicates that the first entity has a higher result than the second entity. An index below 100 indicates that the first entity has a lower result than the second. When looking at the negative volatility loss index, any number above 100 indicates that the company was more likely to lose volume in that position than would the market as a whole. When looking at the volume positive volatility index, any number above 100 indicates that the company was more likely than the remainder of the market to gain volume in that position. Return to Diagnose Segments: Company Share Change and Volatility |
| Recommended Reading |
| For a greater overall perspective on this subject, we recommend the following related items:
Analyses:
Symptoms and Implications: Symptoms developing in the market that would suggest the need for this analysis.
Perspectives: Conclusions we have reached as a result of our long-term study and observations.
|