BASIC STRATEGY GUIDE: STEP 24
Activity Four:
Manage the Company’s cost structure to create Economies of Scale while offering good value to Core customers.
This activity assumes that the Company has created a good value proposition for its target customers. You cannot reduce your costs to increase your profits unless you have customers buying your product. Before you can reduce your costs, then, you first have to find customers and offer them a good value, in the form of unique products and services at an attractive price compared to competition. You do this with the first three activities of the Basic Strategy Guide.
This fourth activity reduces the cost per unit of product you sell. It begins by helping you set reasonable targets for yourself. Some markets are simply more profitable than others and some companies are better positioned in their markets than others. This activity helps you set the right targets for your profitability compared to competition. The most effective way for you to reach your profit targets is to be sure that your organization is reducing its cost per unit of product sold as the business grows. This creates better Productivity and Economies of Scale. This return management activity centers on helping you create these Economies of Scale so that no comparably sized competitor will be able to match your Return on Investment.
Step 24: Identify current shortfalls in financial results.

What:
Use publicly available financial information to set a preliminary target for Return on Investment for the Company. The Company should compare itself to its industry peers on return on Net Capital Employed (RONCE) or on Return on Equity (ROE), in order to determine its costs compared to those of its competitors in the industry. If the Company is analyzing one of its business segments, where comparable competitive data is available, it would use the Return on Allocated Assets (ROA) as the measure for its target.
The Company may further target its relative cost position by establishing goals for its ratios of operating margin and of capital intensity to sales, in support of its Return on Investment target:
-
EBIT/Sales (i.e. return on sales, ROS) which measures primarily the quality of the Company’s management of operating costs (that is, people and outside purchases) and
-
Net Capital Employed (NCE)/Sales, which measures capital intensity and the quality of its capital utilization.
-
If the Company is using business segment data, the comparable measures are operating profits divided by sales (ROA) to measure operating costs and allocated assets divided by sales to measure capital utilization.
Why:
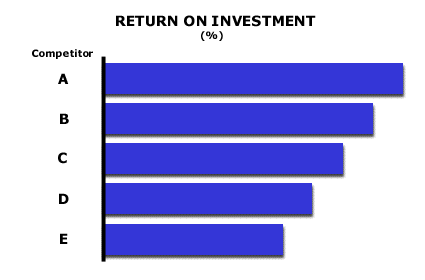
The low cost competitor in the industry has the industry’s highest return on investment. This means that it has the highest:
-
Return on Equity (ROE), which is profit after tax divided by total shareholders equity, or
-
Return on Net Capital Employed (RONCE), which is earnings before interest and taxes divided by the sum of total interest bearing liabilities plus shareholders’ equity, or
-
Return on Allocated Assets (ROA) for a business segment, which is operating profits divided by allocated assets.
Each competitor in the industry operates in the same pricing and cost environment as the other competitors. If a Company could raise or lower its prices to get an advantage over competition, it would do so. So each competitor must offer an attractive value proposition (i.e. a performance for price package) in order to attract and hold its customer base. Each Company’s cost structure and Return on Investment, then, depend more on its ability to deliver good value to customers at a low cost compared to its competition than it depends on the Company’s ability to change its price.
What to Watch For:
-
The median measures for Return on Investment among leading market share companies in the U.S. public markets is 13% for ROE, 15% for RONCE and 11% for Return on Allocated Assets in a business line. If the Company can beat these measures, it should compete well for Capital. Its first priority, however, is to attempt to be the low-cost competitor in the Company’s industry.
-
The median operating margins for businesses in the U.S. public markets include an 8% return on sales at the company level and a 9% return on sales at the business segment level. The Company would prefer a cost position in its industry that allows it to have the highest operating margins among its peer competitors.
-
The median measures for capital or asset intensity in U.S. public markets are 62% (NCE/Sales) for companies and 87% for business segments (allocated assets/segment sales). The Company would prefer to use less capital or assets to generate a dollar of sales than do its peer competitors.
-
In a market that is not Hostile, the average industry’s market share leader leads its industry’s returns less than 30% of the time. Over 70% of the time another, smaller, competitor leads the industry in returns.
-
In a Hostile market, the average industry leader leads its industry in returns only 20% of the time.
-
The Company may use the Return on Investment goal as the first step in a “Design to Value” approach to managing total revenues and costs. Using this approach, it defines the profitability (in the form of a Return on Investment target) it expects and then aligns its cost structure and revenue base in order to create that level of profitability.
Action:
Set a Return on Investment target for the Company’s financial performance using comparisons with peers.
-
Self Test #24: Identifying Shortfalls in Financial Performance
-
Worksheet #24: Identifying Shortfalls in Financial Performance
More Information Identifying Shortfalls in Financial Performance on the Advanced Site >>
For helpful context on this step:
Videos:
Perspectives:
Symptoms and Implications:
