Analysis 24: Competitive Vulnerability
EXHIBITS:
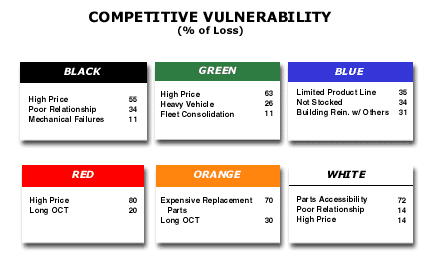
| HOW TO INTERPRET THE ANALYSIS: Explanation: The exhibit shows the competitive vulnerability of six competitors, each named by a color. Inside the box for each competitor, the particular reason for the competitor's weakness is shown along with the percentage of the sales volume the company lost due to each reason. For example, the Black competitor lost share due to high price, poor relationship with its customers and to mechanical failures. By far, the most important reason for the company's loss was high price. This high price caused it to lose 55% of the total volume of its Negative Volatility, while 34% of its Negative Volatility left it because of the company's poor relationship with the customer. Finally, 11% left due to mechanical failures. If the company had Negative Volatility of 10% during the period, it would have lost 5.5% of that 10% due to high price, 3.4% due to poor relationships and 1.1% due to mechanical failures. These are benefits on which the Black company is weak and would be good selling points against it.
PURPOSE: This analysis highlights the weaknesses of each competitor in the marketplace. The company would use this set of weaknesses to sell against those competitors in the marketplace. APPROACH: This analysis results from a thorough debriefing of the sales force and their differences in the marketplace. It also results from the analyses of customer samples the company should undertake. The weaknesses of each competitor may be of two types. The first are those weaknesses that each competitor has for its current customers. The second would be the weaknesses that are perceived by, or experienced by, prospective customers, that is those customers that the competitor is not serving in the marketplace. Return to Diagnose Segments: Competitor Weakness |
|
Recommended Reading |
| For a greater overall perspective on this subject, we recommend the following related items:
Analyses:
Symptoms and Implications: Symptoms developing in the market that would suggest the need for this analysis. Perspectives: Conclusions we have reached as a result of our long-term study and observations.
|