Analysis 25: The Expected Gain Index
EXHIBITS:

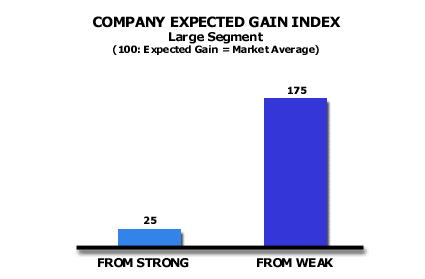
| HOW TO INTERPRET THE ANALYSIS: Explanation: This exhibit results from the company's dividing its competition into Strong and Weak competitors and then evaluating its Positive Volatility gained in competition with the Strong and Weak competitors separately. The company does this analysis for each Customer Size and Role segment where it has particular interest. For example, it would do an analysis for the Large Customer/Primary Role position and then a separate analysis for the Large Customer/Secondary Role position. The exhibit tells us that the company is likely to gain seven times the volume (175 divided by 25 = 7) from Weak competitors that it would gain from Strong competitors. In other words, if the company competes for a relationship where a Strong competitor is the incumbent, the company can expect to gain only 1/7 of the unit volume that it would gain if it were competing for a relationship where the Weak competitor were the incumbent.
PURPOSE: This analysis quantifies the relative probability of gaining volume from strong and weak competitors. APPROACH: An index is a measure of the performance of one entity relative to another entity. The index is the ratio of the performance of the first entity divided by the performance of the second and then multiplied by 100. An index above 100 indicates that the first entity has a higher result than the second entity. An index below 100 indicates that the first entity has a lower result than the second. The company begins with the unit volatility for the customer segment. For example, above, we assume the Large customer segment had a 10% volatility, meaning that 10% per annum of the Large customer segment's volume changed suppliers in each year. The company then calculates the positive volatility that exists in the market when the incumbent shareholder is a strong competitor. This means that a strong competitor held a position in the customer relationship at the beginning of the period. During the period, the strong competitor ceded share, either through a failure or through a competitor win, to another competitor. The company would then calculate the percentage volatility taking place with strong competitors as incumbents. In the example above, the other suppliers gained annually 2.5% of the strong competitors' volume with Large customers. The company would conduct a similar analysis using weak competitors as the incumbents. In the example above, the weak competitors would cede 17.5% of their volume yearly to other competitors. This analysis also assumes a Large customer segment volatility of 10% per annum. The company would use these relative probabilities of share movement to plan its sales programs to potential Get In and Increase Use customers. Obviously, in a case such as the one above, increasing the calling frequency on customers of weak competitors is more likely to produce incremental volume than if the company would focus its selling efforts on customers where strong competitors are incumbents. Return to Diagnose Segments: Competitor Weakness |
|
Recommended Reading |
| For a greater overall perspective on this subject, we recommend the following related items:
Analyses:
Symptoms and Implications: Symptoms developing in the market that would suggest the need for this analysis.
Perspectives: Conclusions we have reached as a result of our long-term study and observations.
|
